Scope 1 and 2 emissions
As an urban services provider, Downer operates within capital and carbon-intensive industries such as asphalt manufacturing. A key challenge is the effective management of our carbonrelated activities and the implementation of strategies to reduce our GHG emissions.
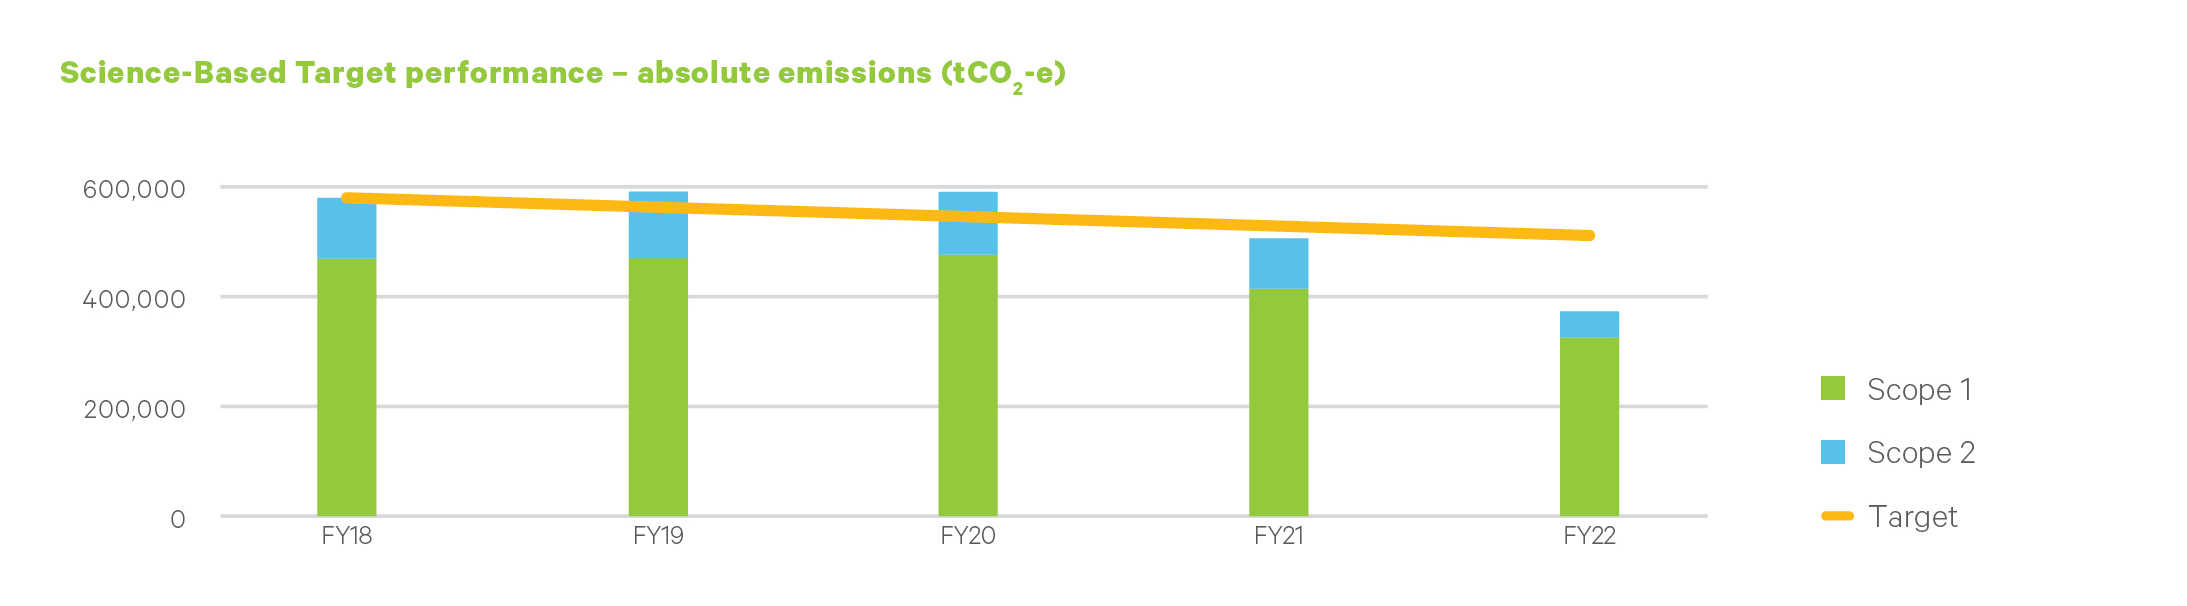
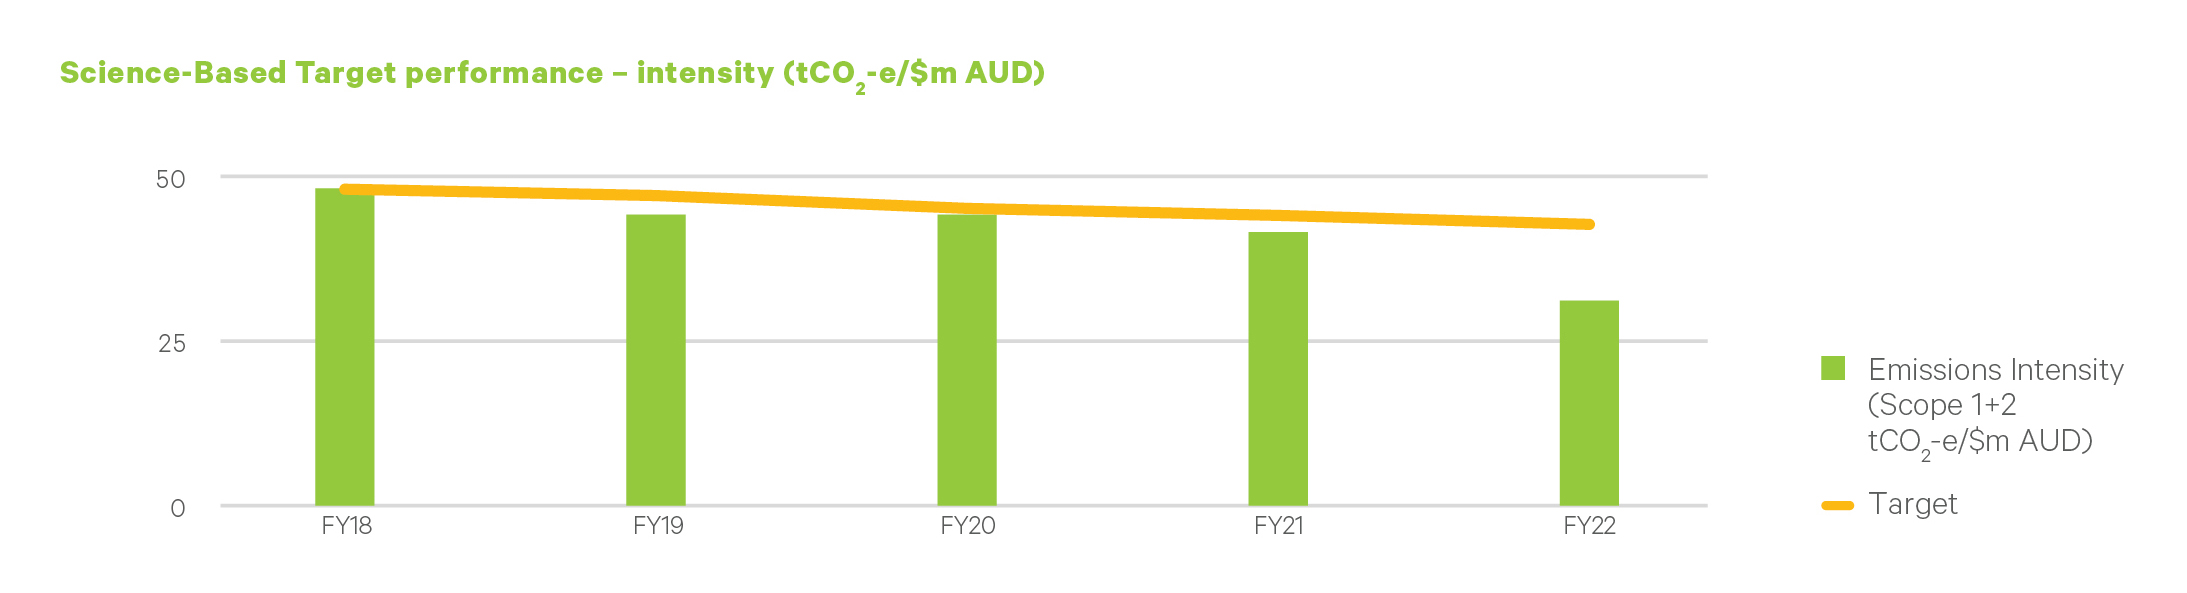
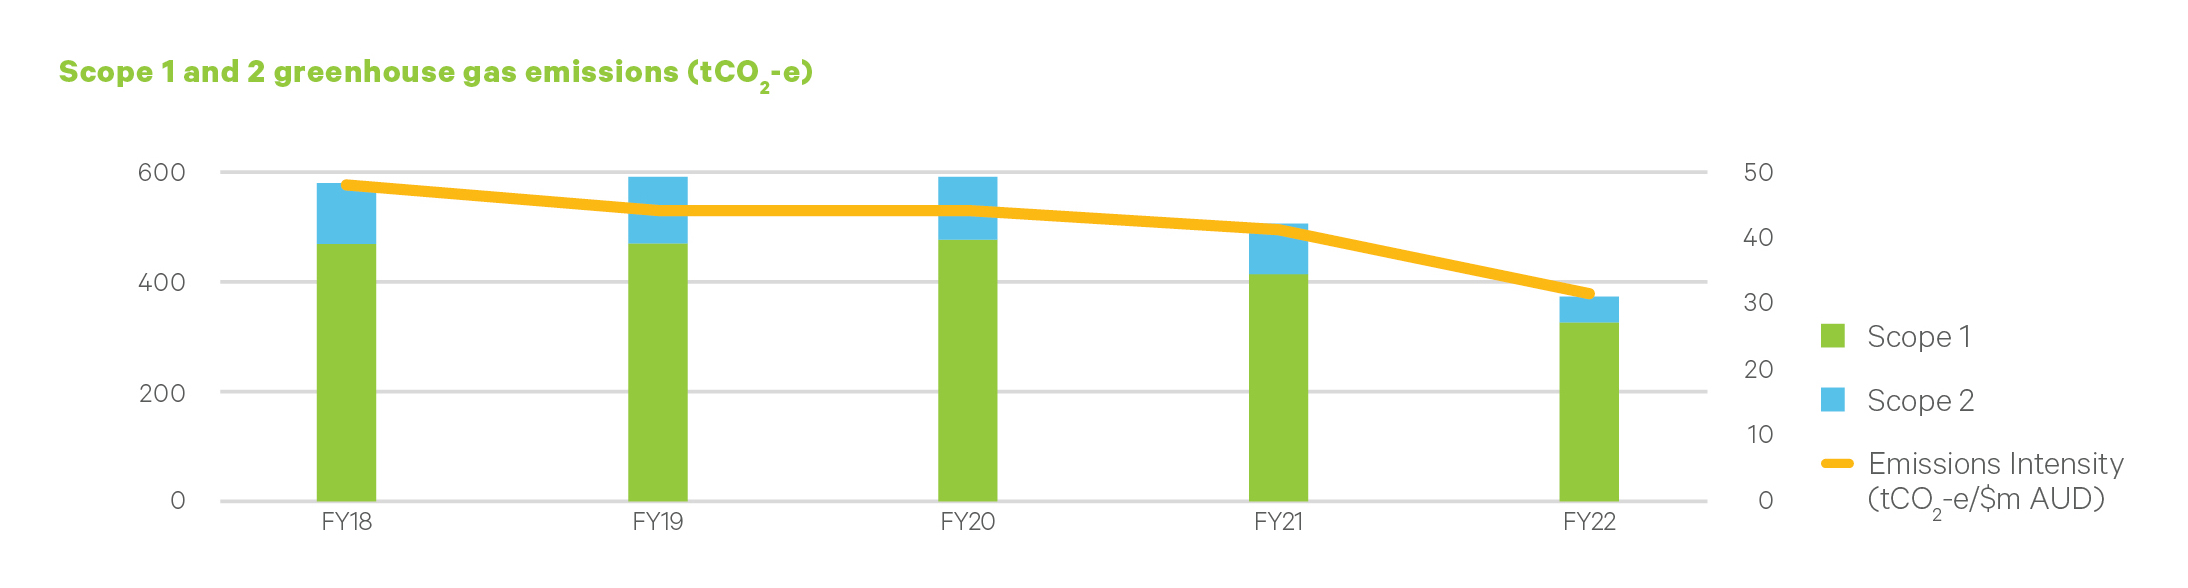
In FY22, Downer completed the sale of its Open Cut East Mining business, representing the finalisation of the divestment of its Mining operations. The sale of these businesses has substantially reduced the Group’s capital expenditure and also reduced our Scope 1 and 2 GHG emissions by approximately 35 per cent – or 206,000 tonnes – of carbon dioxide equivalent, based on FY20 data.
Downer has determined its boundary using the concept of ‘operational control’, compliant with Australia’s National Greenhouse and Energy Reporting (NGER) scheme. For the purposes of energy and GHG data in this Sustainability Report, this boundary determination extends to our operations outside of Australia.
Downer has an extensive subcontractor network and collecting data requires significant effort and remains a challenge. Therefore, we use an estimation methodology when unable to obtain actual data. In FY22, approximately 35 per cent of our Scope 1 emissions came from subcontractors (actual and estimates), which consisted of 16 per cent from our Road Services business, 18 per cent from New Zealand and one per cent from Utilities.
The methodology for estimating data is described below:
Subcontractors are grouped into categories on the basis that they perform similar types of work when engaged by Downer and therefore are very likely to use similar types and relative volumes of energy consuming resources. The information received from these subcontractors forms the actual resource usage data. The remaining energy reported is based on a ratio between actual energy versus equivalent spend, which is applied across the remaining spend per category.
Downer’s New Zealand business was unable to collect actual subcontractor data during this reporting period due to contractor resourcing constraints, therefore the estimation procedure for subcontractor emissions could not be used. Instead, an alternative method was used, with the fuel consumption-to-subcontractor spend ratios calculated through the standard procedure being replaced by the average ratios from the Australian business for similar subcontractor types (haulage and other contractor types).
Downer’s overall Scope 1 and 2 emissions decreased by 26 per cent. Scope 1 emissions decreased by 21 per cent, and this was largely due to the completion of the Mining Services divestment, which has led to a significant decrease in fuel usage.